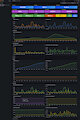
Grafana monitoring dashboard for the Inkbunny LA cache node. Running on a self-hosted Proxmox homelab with a 10TB ZFS cache pool.
Stats shown are over the last 7 days:
430 GB cached, 193k files
548 GB bandwidth served, 246 GB saved from cache hits
18.7% hit rate (still warming up), 44.9% savings rate
Top files tracked by bandwidth with per-file breakdowns
Built with Telegraf + InfluxDB + Grafana. Data collected from nginx access logs on CT203 via Starlark parsing, pushed to InfluxDB, visualized here.
Just a nerdy homelab thing.
Keywords
inkbunny
1,299,
dashboard
612,
linux
89,
monitoring
10,
networking
3,
cache
3,
grafana
2,
homelab
2,
proxmox
2,
influxdb
2,
self hosted
2
Details
Published:
2 months, 4 weeks ago
18 Jun 2026 18:03 CEST
Initial: b6faf8ed9040b50fa0db7c3d7d6744a7
Full Size: 517aca5ab3db8881997e7bc32589f0fe
Large: 4d3da3df1cb38926fc2a039975d0d37a
Small: c7c199821627596759c6aca7c5c806f9
Stats
24 views
0 favorites
2 comments